- Joined
- Jan 25, 2014
- Messages
- 11,945
- Reaction score
- 1,221
- Points
- 159
Surveys of 374,000 adults give us the clearest picture yet of where LGBT Americans live
VOX dot com | by German Lopez | March 20, 2015, 2:30 p.m. EDT
SOURCE
I'm not a statistician so what the percentages in the graphic represent isn't clear to me. For example: San Francisco shows 6.2%... what does that represent? Is it 6.2% of the total population of San Francisco or of poll respondents or what? I imagine it is the latter but that would mean the other 93.4% of respondents replied in the negative. So out of the 340,000 adults how many were from San Francisco and how many were from Birmingham? I'm sure the answer is simple and clear as a bell to someone, lol, just not me.
It's late and I'm getting tired. I just saw this and thought I'd post it.
VOX dot com | by German Lopez | March 20, 2015, 2:30 p.m. EDT
Demographic researchers have long been working to map the geographic spread of America's LGBT population. But analyses have been difficult to conduct since the US Census, the most comprehensive source of demographic data in the country, doesn't ask people questions about their sexual orientation or whether they're transgender.
A new analysis by Gallup, based on surveys of more than 374,000 adults across the country, gives the clearest insight yet for the 50 largest metropolitan areas. It shows that more LGBT people live in the West, even in conservative cities like Salt Lake City, but are less likely to reside in the South and Midwest.
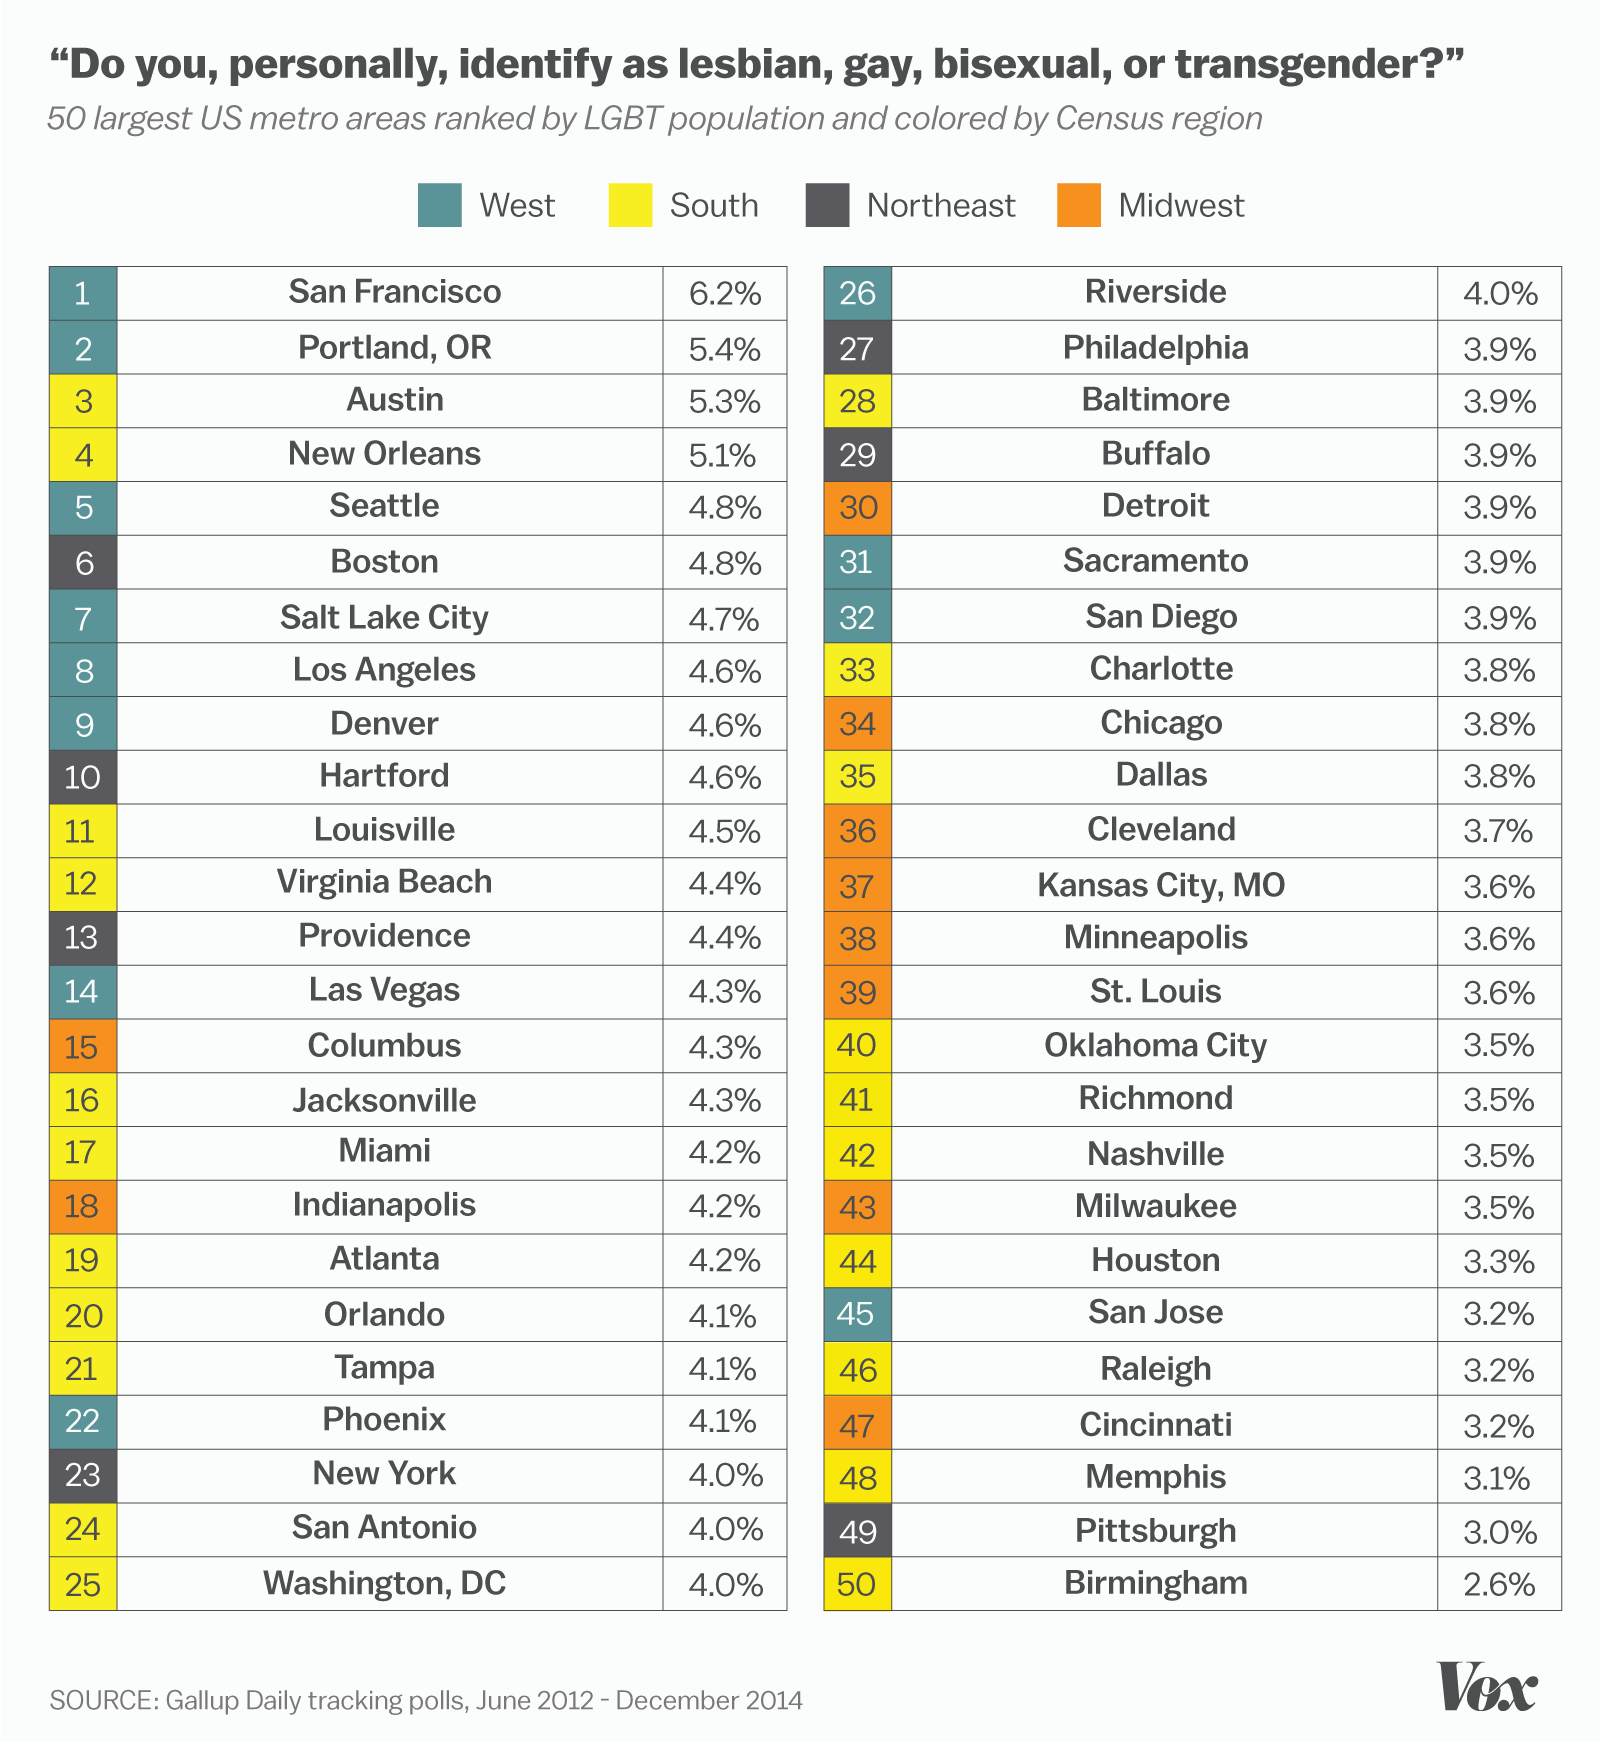
As the New York Times' David Leonhart and Claire Miller noted, the larger LGBT populations in some metropolitan areas may show that people tend to relocate to one area in a region where they're more likely to be accepted. Rural places in Utah and Oregon, for example, are generally less accepting of LGBT people, which may convince gay, lesbian, bisexual, and trans people to leave their homes and head to cities such as Salt Lake City or Portland, Oregon, where they'll likely find more inviting communities, since cities tend to be more progressive.
But the survey also may reflect cultural attitudes that make it easier for someone to say they're LGBT in a survey. Oftentimes, it's a lot easier for someone in San Francisco, one of the most LGBT-friendly cities in the country, to come out as gay than for a person in Birmingham, Alabama, a city known for its social conservatism, to do so.
The report also found very little variation from city to city. The difference between San Francisco, which is first in the ranking, and Birmingham, which is last, is only 3.6 percentage points. So while some LGBT people may flock to more accepting places in the West, there are still sizable populations living in places for other reasons, such as jobs, family, or hometown attachment.
SOURCE
I'm not a statistician so what the percentages in the graphic represent isn't clear to me. For example: San Francisco shows 6.2%... what does that represent? Is it 6.2% of the total population of San Francisco or of poll respondents or what? I imagine it is the latter but that would mean the other 93.4% of respondents replied in the negative. So out of the 340,000 adults how many were from San Francisco and how many were from Birmingham? I'm sure the answer is simple and clear as a bell to someone, lol, just not me.
It's late and I'm getting tired. I just saw this and thought I'd post it.
Last edited: